The second piece in this series is dedicated to modelling and to monetary policy. It has been motivated by this nice chart from the Goldman Sachs:
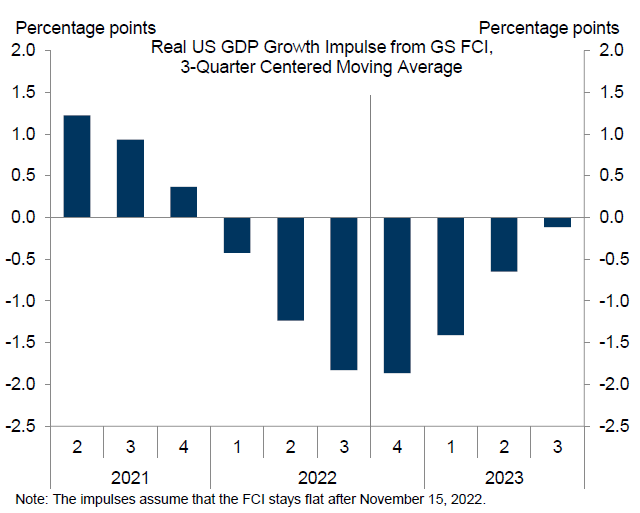
This chart is highlighting that we should not think that recession
is coming just because of the tightening we have seen already, because lot of the
effect of tightening has already been felt simply because tightening has started
almost a year ago. Which I think is important point to make and the chart is
very useful in putting numbers to this idea.
That said, after thinking about this chart I started
wondering whether it does not overstate its case. The odd thing that stroked me
was the fact that the effect of the tightening is tending to zero over time. At
first glance it does sound reasonable that after tightening ends the effect it
has should gradually become zero. And in-so-far as focusing on the process of
tightening (that is raising rates), this is just logical conclusion.
However, that is not how this graph is being used and interpreted.
The chart was being used to argue that the impact of monetary policy as such
is going to wane in coming quarters, which is a different point from the impact
of just the tightening process. The point to realize is that the end point of
tightening is relevant; in other words, if we end up with high interest rates[1],
then that should have negative effect on growth irrespective of whether the
rates are being raised further or not. In the parlance of Fed, they want to raise
rates to rates to restrictive level and keep them there. The use of word
“restrictive” implies that that high level will have continuously negative
effect on aggregate demand as long as rates are at that level. In other words, the
effect of tightening will be non-zero even after the end of the tightening
process; as higher rates stay, the effect will stay as well.
How is this all related to power of transformation? Well, in
the report where the chart was used the authors come clean and say that the
model links the effect on growth to changes in the financial conditions
index. This then leads to the conclusion that when changes in monetary policy
go to zero, the effect goes to zero. However, the choice of changes in
financial conditions as the driver of growth is not as self-evident as it might
seem. I can as plausibly argue that it is the level of financial conditions
that is relevant for growth, with high level implying lower growth. Indeed,
this is what one would take away from standard macroeconomics models.
Ultimately, the point is not that either changes or level is
the correct choice.[2] I
think it is fair to say that both matter: level is important, but rapid changes
in level can carry much bigger punch than the change in level alone would imply,
and hence changes are important too. The point is different: The story the
chart (and underlying model) say is really a function of the choice of transformation;
if different transformation would be used, the story would be completely
different. Hence the power of choice of transformation.
[1]
High of course needs a benchmark, as in high relative to what. Here I mean high
relative to (long-term) neutral rates.
[2] I
would view this view irrespective of econometric arguments. For example, I am
pretty sure the authors chose changes in financial conditions index either
because they concluded that the series
has a unit root, or because they concluded that it fits better. Neither of
these would persuade me that this is the only correct perspective.
No comments:
Post a Comment